There are cases where you need to create dynamic ppt power point presentations to show up to the minute data.
It could be text or even charts that need to be latest. In such case, your base data and charts can lie in a spreadsheet and there will be a “link” from the ppt to the XLS to pick up any changes done there in real time.
Here is the step by step guide on how to embed charts and tables from Excel into a PowerPoint presentation.
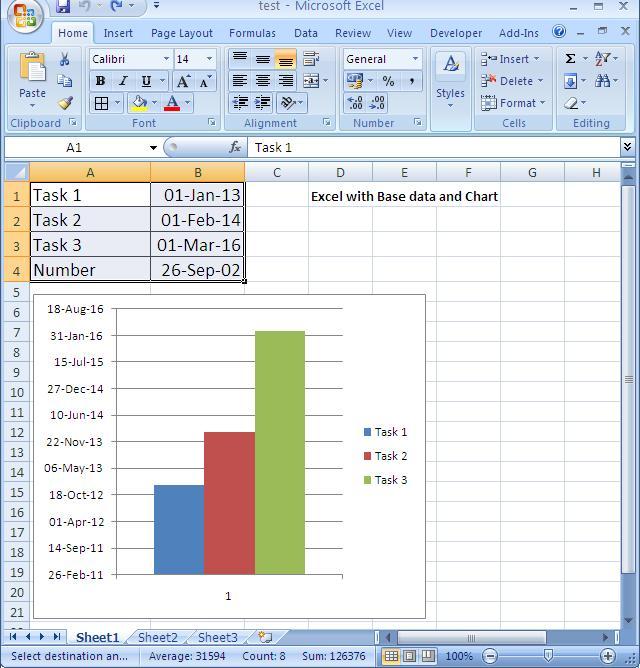
See the screenshot of XLS below which will be have the base data. Select the whole table in XLS and do Control + C to copy

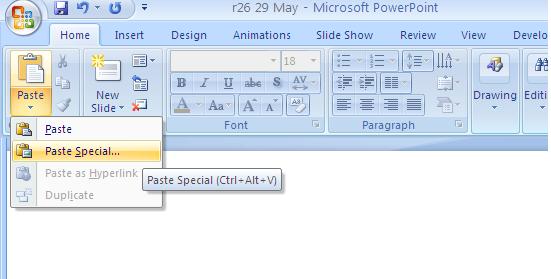
Go to ppt and Home-> Click on the arrow that will expand the Paste option to reveal “paste special”

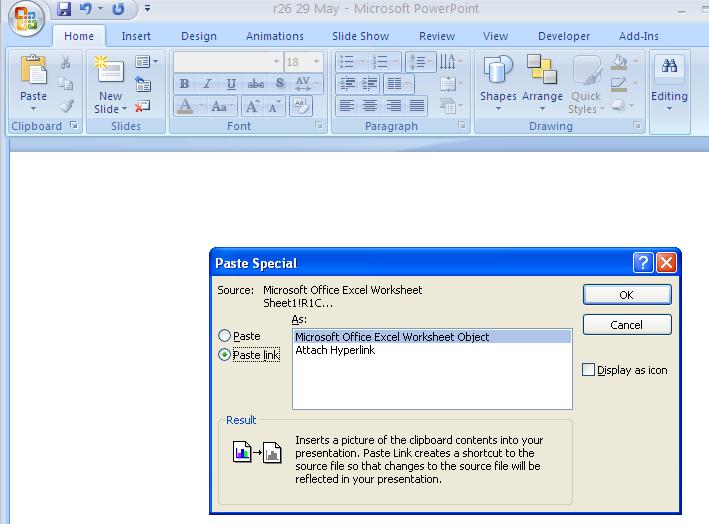
On the dialog box that appears, click the radio button that says “Paste Link”. In the “As box”, select the option that says “Microsoft Office Excel Worksheet Object”
Click ok

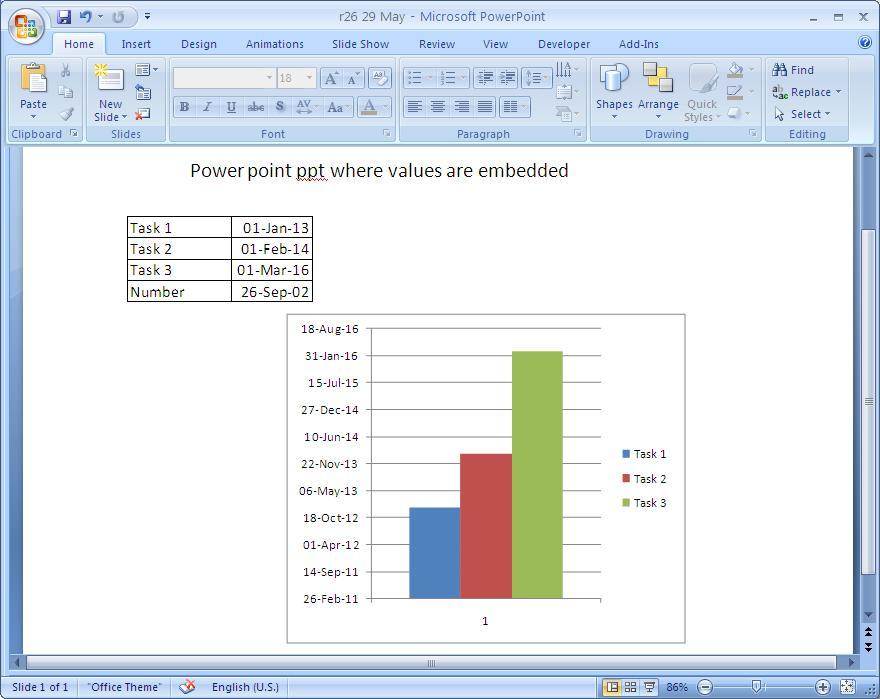
Viola! Your table from Excel is now linked with ppt table.
Try changing data in base excel and save it, you will see that it is automatically changing values in ppt
To copy the chart, follow the same steps as above. Only change being in step3 where you select “Microsoft Office Excel Chart Object”. What I have observed is, ppt is quite smart. Depending on what you have copied using Ctrl+C (text or chart), it will show you the appropriate option to choose to link.

Limitation of dynamically linking ppt with XLS:
One limitation is to make sure that the location of XLS stays in the original place when the embedding was done.
Secondly, if you have to email the powerpoint, the receiver will get a message while opening that “its linked to a file that unable to link”. It will still show the original data that you embedded though. If you wish to give someone ability to change the base XLS data, then make sure you send both files – ppt and Excel and the receiver saves the files in a directory.
Even though you linked the files dynamically, while mailing, it does NOT send both files, you have to send it.